What we fix with this
The three reporting problems we solve most often.
Recurring challenges we see across growing SMEs — and how we solve them.
Business data scattered across multiple systems
Finance, sales, HR and operations all work in different platforms — ERP, CRM, accounting, payroll and spreadsheets. As a result, no one has a complete picture of the business. We centralize data from every system into a single, trusted reporting layer.
Manual month-end reporting
Finance teams spend days exporting data, updating spreadsheets and reconciling numbers before management can review performance. We automate data collection, consolidation and reporting, reducing month-end reporting from days to minutes.
Reports that don't drive decisions
Leadership receives dashboards full of charts but without meaningful business insights. We build decision-focused dashboards with KPIs, plan vs. actual comparisons, variance analysis and automated commentary so management can act with confidence.
Data & reporting foundation · Meetball
Helping Meetball build a scalable data & reporting foundation.
Meetball operates a hybrid business model combining SaaS subscriptions and advertising revenue. As the business expanded, operational and financial data became fragmented across multiple sources — making reporting, KPI tracking, and strategic decision-making increasingly difficult.
Client
Meetball
Industry
Hybrid SaaS + advertising platform
Stage
Growth-stage · multi-revenue model
Centralized reporting
More structured and centralized business reporting replacing fragmented spreadsheets and ad-hoc views.
Revenue transparency
Improved transparency around subscription and advertising revenue metrics, with faster access to operational insights.
Less reporting overhead
Reduced reporting inefficiencies and stronger scalability for future analytics and BI initiatives.
Strategic visibility
Stronger management visibility into the metrics that drive decisions across the business.
The challenge
What the engagement needed to deliver.
- 01Consolidate data spread across multiple spreadsheets and systems
- 02Standardize KPI definitions across business functions
- 03Improve visibility into subscription and advertising revenue streams
- 04Reduce manual reporting work and create decision-ready management reporting
Our role
How we worked with the team.
We worked closely with the business to organize key operational and financial data into a more scalable reporting framework.
- 01
Data consolidation
Mapped fragmented operational and financial datasets and consolidated them into clearer, centralized reporting structures.
- 02
KPI architecture
Supported standardization of KPI definitions across business functions and built dedicated visibility into the subscription and advertising revenue streams.
- 03
Reporting workflow
Streamlined reporting workflows to reduce manual effort and helped produce decision-ready management reporting for leadership.
Decision-driven reporting
Reporting that answers the questions leadership actually asks.
Examples from a SaaS FP&A engagement on Power BI — KPI steering, cohorts, budget control, ARR decomposition.
Executive Performance Dashboard
Budget vs. actual on revenue and EBITDA, churn and margin — with a traffic-light health score and ranked recommendations leadership can act on.
- Budget vs. Actual
- Health score
- Recommendations
- Variance
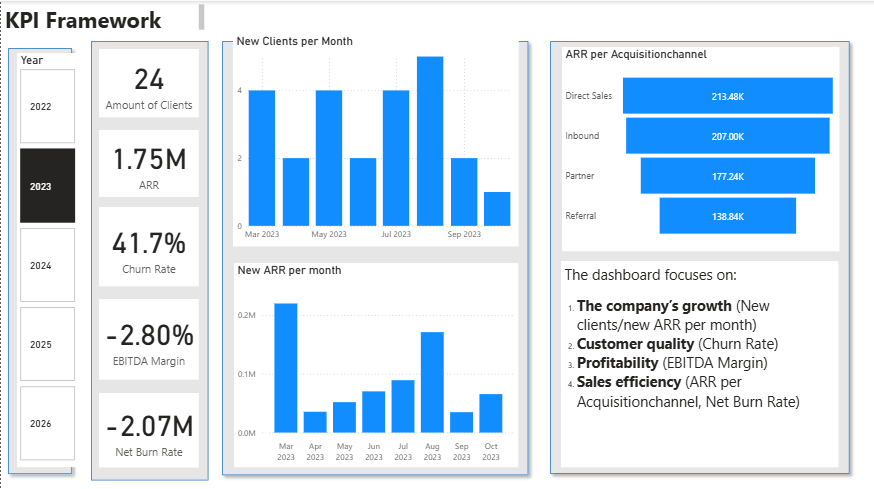
KPI Framework
One view of growth, customer quality, profitability and sales efficiency — built for monthly leadership reviews.
- ARR
- Churn
- EBITDA margin
- Net burn
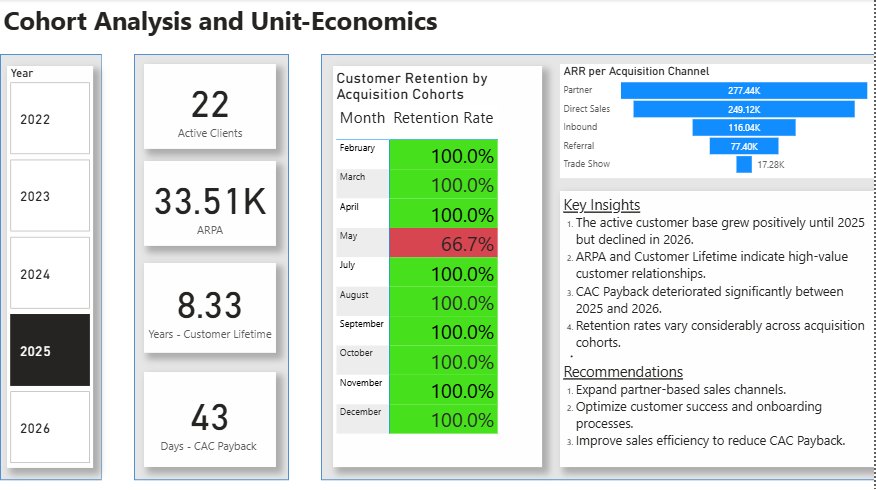
Cohort Analysis & Unit Economics
Retention by cohort, ARPA, lifetime and CAC payback — showing where the business actually compounds.
- Retention
- ARPA
- CAC payback
- LTV
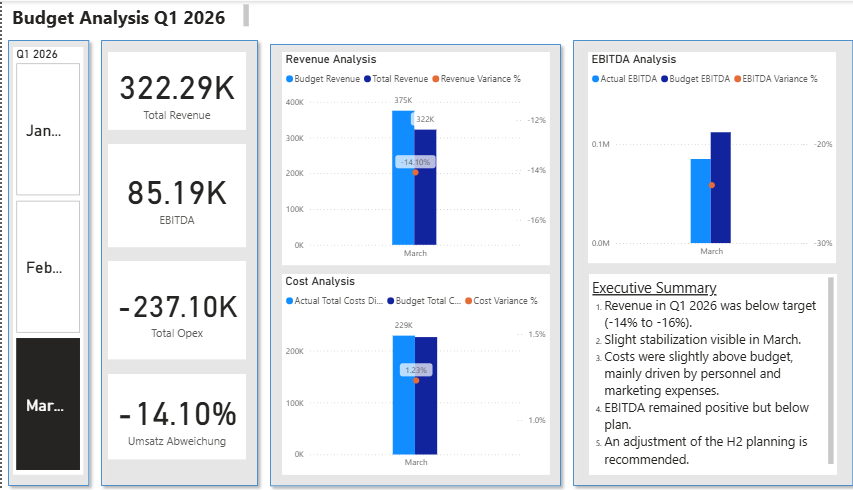
Budget vs. Actual
Quarterly P&L control with revenue, cost and EBITDA variance — plus a 30-second executive summary.
- Variance
- EBITDA
- Opex
- Commentary
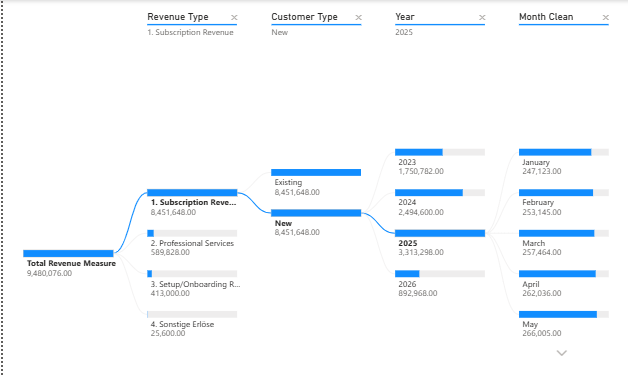
ARR Decomposition
Revenue split by stream, customer type and time — ends the “where is the growth coming from?” debate.
- Subscription
- New vs existing
- Drill-down
Sample dashboards from a SaaS FP&A & KPI steering project. Figures shown are illustrative.
Key focus areas
The disciplines this engagement drew on.
- Data organization
- KPI architecture
- Revenue reporting
- Operational reporting
- Process optimization
- BI foundations
Have a similar challenge?
Free 20-minute review of your metrics, revenue drivers, and bottlenecks — no slides.